This summer I’m being supported in my PhD work through Prof. Ron Eglash’s Triple Helix program. One of the earlier fellows on the project, John Drazan, did a project on the same grant called “Science of the Slam” in which he used athletics as an avenue for science education in K-12 urban schools. One workshop in particular focused on jump plates – students would jump up and down on a wooden pressure plate and the plate would send a signal to a computer and visualize their jump using MATLAB, giving them information about jump height and air time.
My work so far with Triple Helix has been picking up where John left off, rebuilding the jump plate using open technologies (Arduino and Python) and improving upon it.
The first step was to identify the libraries I needed. The pySerial library has provided the appropriate backend to interface the Python application with Arduino. The graphical frontend is achieved using matplotlib, which makes the MATLAB-like data visualization in Python really easy. There are a whole lot of options out there for Python data visualization, and I tried to pick the one that would produce the most functional graphs with the least work.


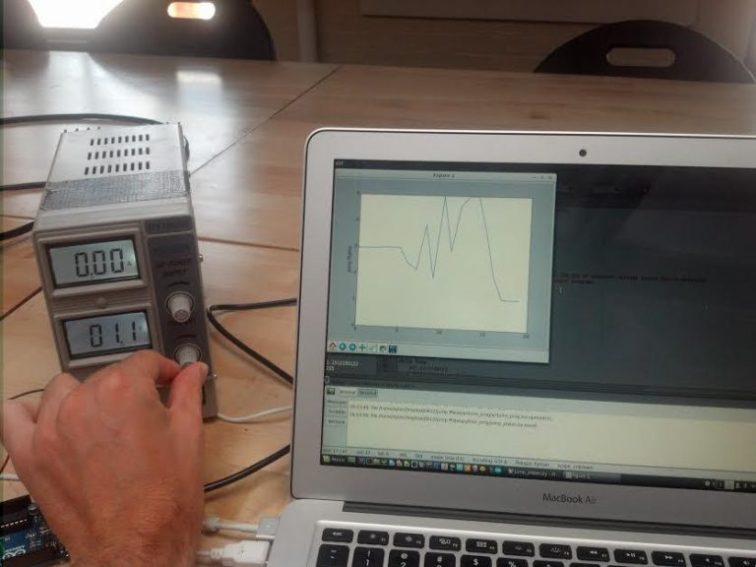
So far I’ve got the Arduino reading a 0-5V analog voltage from a DC power supply and plotting it to a computer terminal. It’s able to refresh the graph with a new data point every 200ms, which is not bad although I’d like to push that speed up if I can. The bottleneck seems to be matplotlib’s data visualization more than the Arduino’s ADC circuitry.
Now that I can reliably read and plot voltages, the next step will be to interface with real sensing hardware. More updates on that soon.


Comments
No comments yet. Be the first to react!